Filters
Aligning Your GTM Strategy: 8 Metrics You Can't Ignore!
Thanks for being one of over 175,000 forward-thinking GTM Leaders who subscribe to this weekly research note.
This week’s research note includes:
GTM Research: 8 GTM Metrics You Can’t Ignore
Spotlight: Caitlin Clark-Zigmond
Event: Better Together Leadership Summit
Research: 8 GTM Metrics You Can’t Ignore
Creating a successful go-to-market (GTM) strategy isn’t just about aligning your team around a vision—it’s about operationalizing that vision with clear metrics that inform every decision.
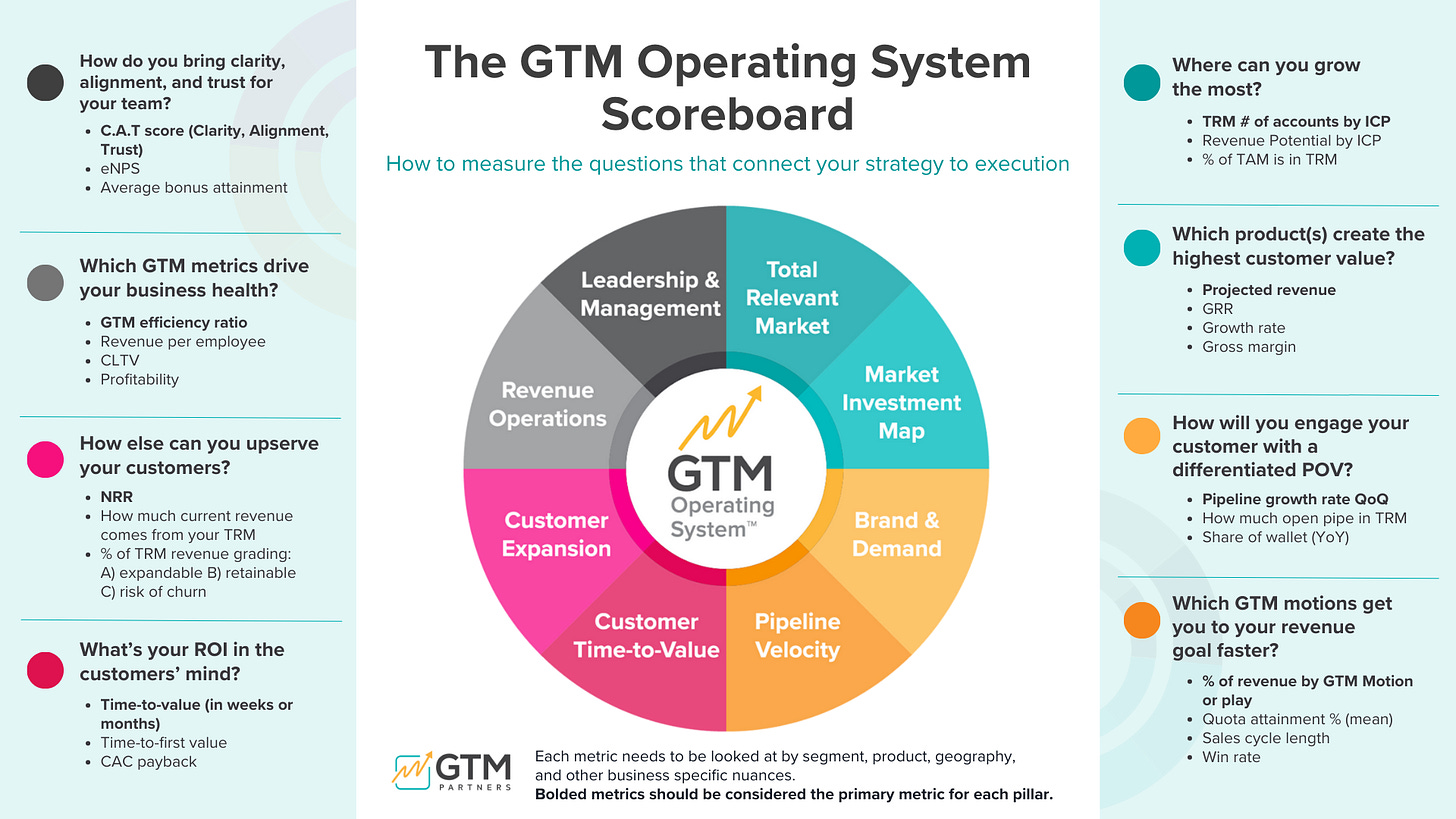
The GTM Operating System (OS) provides a framework that connects strategy to execution by focusing on eight core pillars that cross departmental silos.
Here, we break down the essential metrics for each GTM pillar to help you prioritize and optimize your go-to-market approach.
For each pillar, we’re suggesting one PRIMARY metric along with a few others that might be useful.
Pillar 1. Total Relevant Market (TRM): Identifying Where to Grow
Key Question: Where can you grow the most?
Primary Metric:
TRM Accounts by ICP: Number of accounts within your ideal customer profile (ICP).
Other Metrics Worth Tracking:
TAM vs. TRM Percentage: Percentage of total addressable market (TAM) that falls within TRM.
Many businesses focus on their TAM—the big, shiny number. But honing in on your TRM helps you identify actionable growth opportunities.
Pillar 2. Market Investment Map: Prioritizing Product Value
Key Question: Which products create the highest customer value?
Primary Metric:
Projected Revenue: Anticipated revenue by product.
Other Metrics Worth Tracking:
Growth Rate: Rate at which each product is expanding.
Gross Margin: Profitability of each product.
Gross Revenue Retention (GRR): Customer retention rate excluding expansion.
It’s crucial to evaluate products not just on revenue potential but on their margins and retention rates.
Businesses often get excited about launching new products without fully considering whether they’re aligned with growth and margin goals.
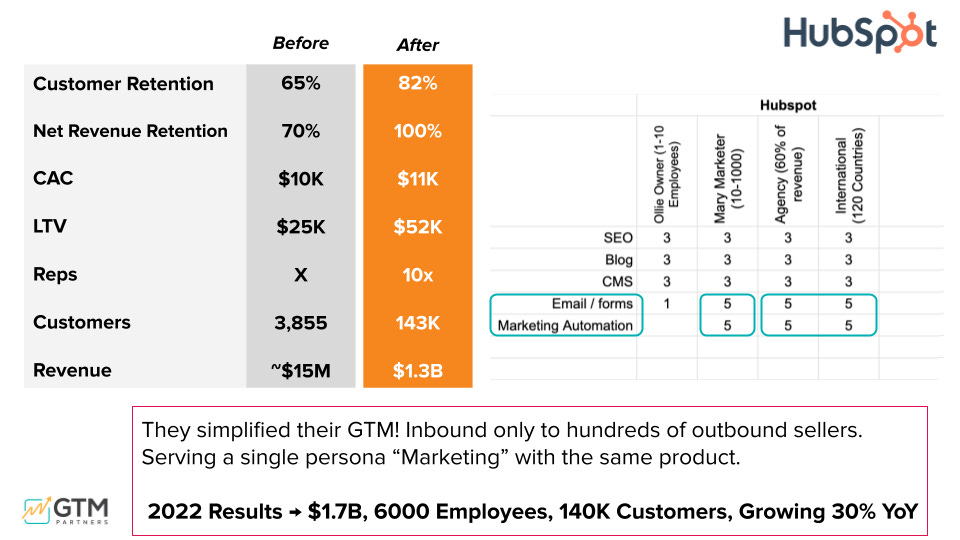
Learn how Hubspot mastered the Market Investment Map.
Pillar 3. Brand & Demand: Engaging Customers with a Differentiated POV
Key Question: How will you engage your customer with a differentiated POV?
Primary Metric:
Pipeline Growth Rate (QoQ): Quarterly pipeline growth.
Other Metrics Worth Tracking:
Share of Wallet: Percentage of total potential revenue captured by your brand.
Organic Growth: Increase in branded search queries or G2 reviews.
Read 5 steps to creating a differentiated Point of View.
Pillar 4. Pipeline Velocity: Accelerating Revenue Generation
Key Question: Which GTM motions get you to your revenue goal faster?
Primary Metric:
Revenue by GTM Motion/Play: Contribution of inbound, outbound, product-led, etc.
Other Metrics Worth Tracking:
Quota Attainment Percentage: Average quota fulfillment by sales reps.
Sales Cycle Length: Time taken to close a deal.
Win Rate: Percentage of deals won.
Tracking revenue by GTM motion is a unique approach that allows businesses to see which plays drive the most revenue.
Here’s a list of far more detailed metrics for each of the 6 GTM Motions.
Pillar 5. Customer Time-to-Value: Demonstrating ROI Quickly
Key Question: What’s your ROI in the customer’s mind?
Primary Metric:
Time-to-First Value: How long it takes customers to see initial value.
Other Metrics Worth Tracking:
Time-to-Full Value: Time until customers realize complete ROI.
CAC Payback Period: Time required to recoup customer acquisition costs.
Balancing time-to-value with retention is critical to long-term success.
Read more about how to accelerate Customer Time to Value with mapping.
Pillar 6. Customer Expansion: Maximizing Upsell Opportunities
Key Question: How else can you upserve your customers?
Primary Metric:
Net Revenue Retention (NRR): Revenue from existing customers, including expansion.
Other Metrics Worth Tracking:
Revenue from TRM: How much current revenue comes from your total relevant market.
TRM Expansion Potential: Percentage of TRM that is expandable, retainable, or at risk.
Consider grading revenue by categories—A (expandable), B (retainable), and C (at risk). This approach helps teams prioritize efforts where they can have the most impact.
Learn why NRR is the single most important metric for efficient growth.
Pillar 7. Revenue Operations: Driving Business Health
Key Question: Which GTM metrics drive your business health?
Primary Metric:
GTM Efficiency Ratio: Revenue generated per dollar spent on GTM efforts.
Other Metrics Worth Tracking:
Revenue per Employee: Measures productivity.
Customer Lifetime Value (CLTV): Total revenue generated from a customer over their lifetime.
Profitability: Reflects the organization’s overall financial health.
RevOps is not just about hitting numbers; it’s about understanding the trends and aligning your strategy with where your company needs to go.
Learn how RevOps can improve productivity up to 20%.
Pillar 8. Leadership & Management: Building Clarity, Alignment, and Trust
Key Question: How do you bring clarity, alignment, and trust for your team?
Primary Metric:
C.A.T. Score: Measures how clear the strategy is and whether the team is aligned on execution. As noted in the discussion, this score is more than just a number—it’s a reflection of whether everyone is on the same page about the company’s biggest challenges and goals.
Other Metrics Worth Tracking:
Employee Net Promoter Score (eNPS): Gauges employee satisfaction and engagement. While eNPS is a valuable metric, but doesn’t necessarily capture alignment across GTM teams.
Bonus Attainment Average: Reflects how well compensation aligns with performance. This can help measure whether incentives are driving the right behavior.
The Power of Alignment Across Pillars
Each GTM pillar has unique metrics that contribute to the bigger picture of organizational health and growth. However, success hinges on alignment across teams that drives true transformation. Using tools like the C.A.T. score and TRM assessments ensures that your team is not just executing but doing so in sync with overarching goals.
By leveraging these metrics and focusing on clarity, alignment, and execution, your GTM strategy will become a well-oiled machine capable of driving sustainable growth and customer value.
Are you struggling to align your team across a common GTM strategy?
We lead specialized workshops for B2B companies who want to understand how metrics can align teams across silos.
Our only requirements are 1) that the CEO must be involved in the process and 2) you must be $10M+ in revenue.
We have three spots left for Q1.
Spotlight: Caitlin Clark-Zigmond
Caitlin Clark-Zigmond, Senior Director of Global Software/SaaS Marketing at Intel is GTM Certified and also a GTM Ambassador.
Watch how she uses the GTM O.S. Certification in her business:
Event: Better Together Virtual Summit
Discover the secrets to Go-to-Market success in this two-part virtual series. Learn how industry leaders leverage key GTM metrics to drive growth and align teams, and explore the tech stacks powering enterprise efficiency and ROI.
This is a two-part event to be hosted on February 13 and March 13. Please join us!
Part One (February 13) - Top 5 GTM Metrics used by CXOs
Part Two (March 13)- 6 Enterprise Tech Stacks
Happy Martin Luther King Jr. Day and Inauguration Day to all who celebrate!
Love,
Bryan and Sangram


